
Automating Daily Power BI Dataset Exports to Excel with Power Automate
Recently, I worked with a client who needed a daily export of a subset of their Power BI dataset saved as an Excel file in a SharePoint site. While Power BI does allow you to manually export data, relying on manual steps quickly becomes inconsistent — especially when the process needs to run every day, follow the same structure, and be reliable long-term.
This is where Power Automate becomes a great solution.
In this post, I’ll walk through a few practical techniques for pulling data from an existing Power BI dataset and transforming it into an Excel file automatically. The focus isn’t on rebuilding reports or duplicating logic — it’s about efficiently reusing what already exists.
One important thing to know going in: there isn’t an out-of-the-box action in Power Automate that simply creates a brand-new Excel file with data already in it. Excel automation requires you to work with predefined tables and headers before rows can be added.
The approach used in this post for creating a new Excel file and setting up tables is based on an excellent walkthrough by Matthew Devaney, which clearly explains how to handle this limitation in Power Automate. I’ll build on that foundation and focus specifically on how it applies when your data source is a Power BI dataset and your end goal is a repeatable, daily export stored in SharePoint.
If you haven’t read it already, I highly recommend his article on creating Excel files in Power Automate — it’s a great reference and pairs perfectly with the solution outlined here.
Part 1 - Create Power BI Data Query
If you spend most of your time in Power BI, you’ve likely already done the hard work — building a clean dataset with the right calculations, filters, and business logic. Rather than recreating all of that logic in Power Automate, you can reuse the exact query Power BI is already running.
The key is to extract the DAX query behind a visual and use it as the data source for your automated export.
1. Open Power BI Desktop and locate the table or visual that contains the data you want to export. If needed, create a hidden table or visual specifically for this purpose so you can control filters and calculations without impacting report visuals.
2. From the View tab, open Performance Analyzer, select Start Recording, and then select Refresh visuals to capture the query Power BI runs in the background.

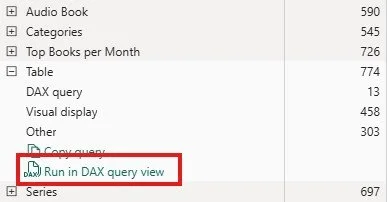
3. In the Performance Analyzer pane, locate your table and select Run in DAX query view. This opens a new window containing the full DAX query used to generate the table, including any applied filters and calculations.
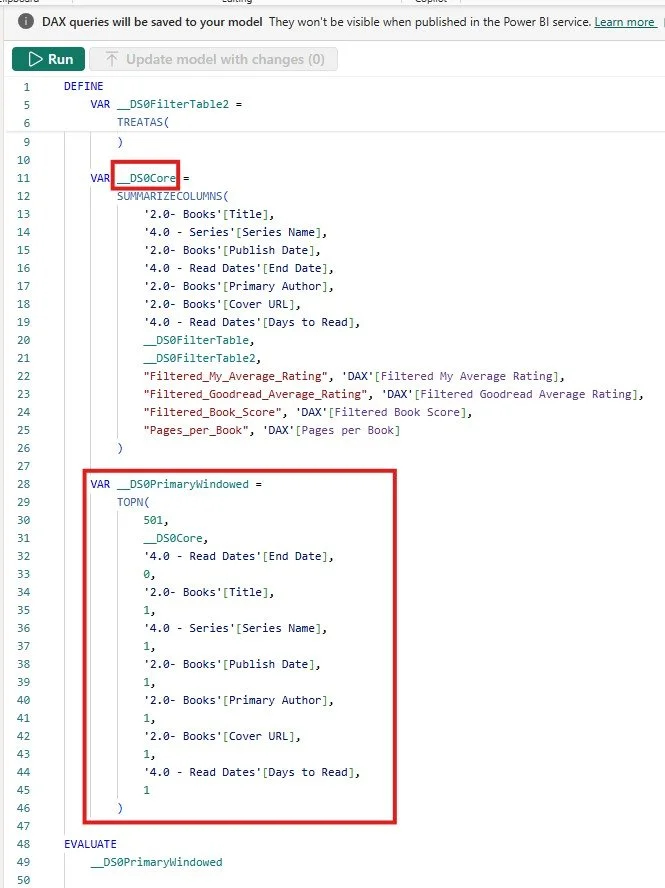
4. Review the generated query and remove the TOPN function, which Power BI uses by default to limit the number of returned rows. Update the EVALUATE statement to reference the __DS0Core table so the query returns the full dataset.
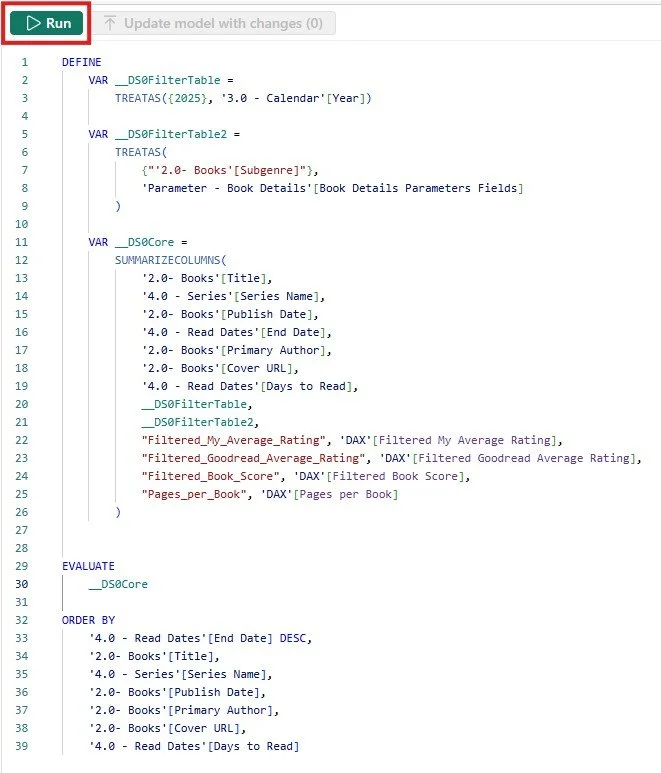
5. Re-run the query to confirm that the results are complete and match your expectations. Leave the DAX Query view open, as you will copy this query in the next section when configuring Power Automate.
Part 2 - Create Power Automate Flow
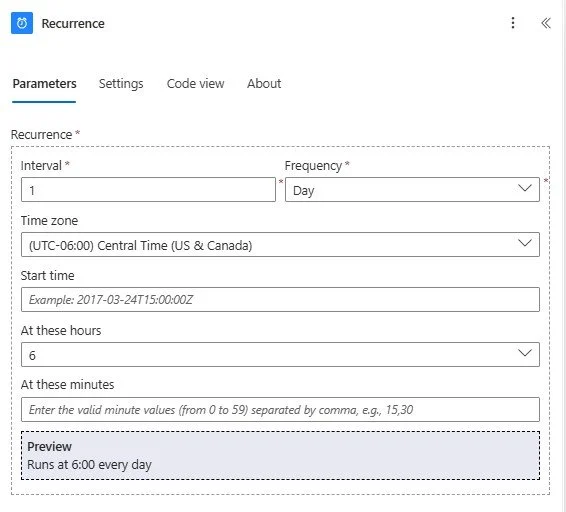
Open Power Automate and create a Recurrence flow. Configure it to run on your desired schedule and time.
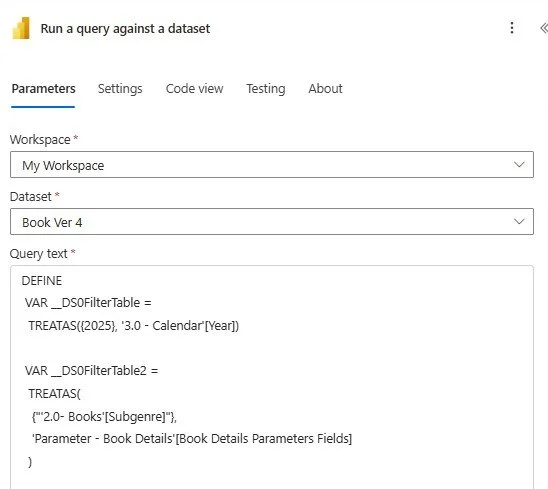
2. Add the Run a query against a dataset action. Select the workspace where your report is published and the dataset name. Copy and paste the DAX query from Part 1 into the Query Text field.
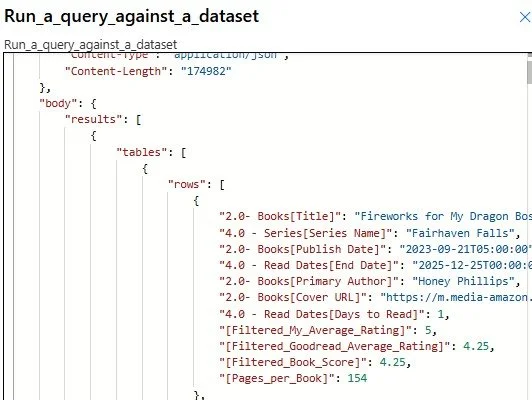
3. Test the flow and review the output from the dataset query. Copy the first item from the results and paste it into a text editor (such as Notepad) so you can easily reference the exact column names in the next steps.
4. Add a Select action. In the From field, choose First table rows from the dataset query output. Define the column names you want to use in the export. These names do not have to match the column names coming from Power BI.
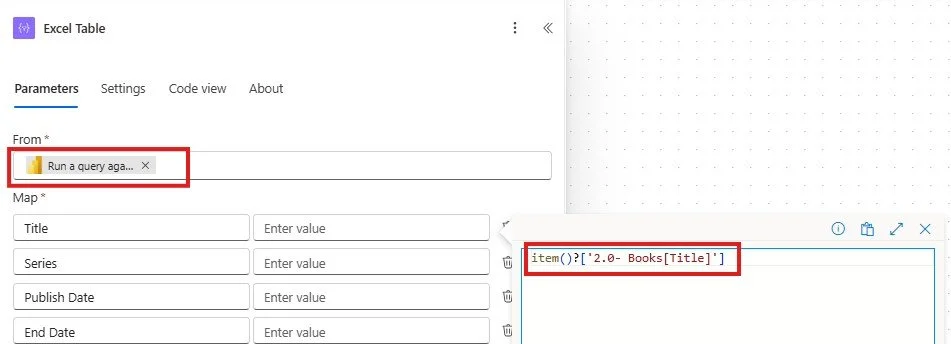
5. For each column in the Select action, reference the Power BI data using the following format:
item()?['Name from query result']
Example: item()?['2.0- Books[Title]']
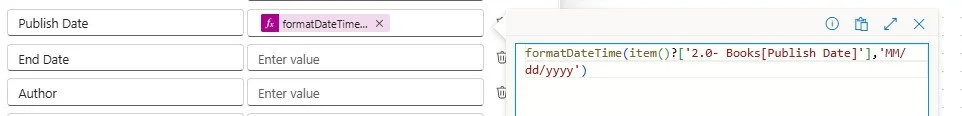
For date columns, you may need to format the value using formatDateTime, for example:
formatDateTime(item()?['2.0- Books[Publish Date]'],'MM/dd/yyyy')
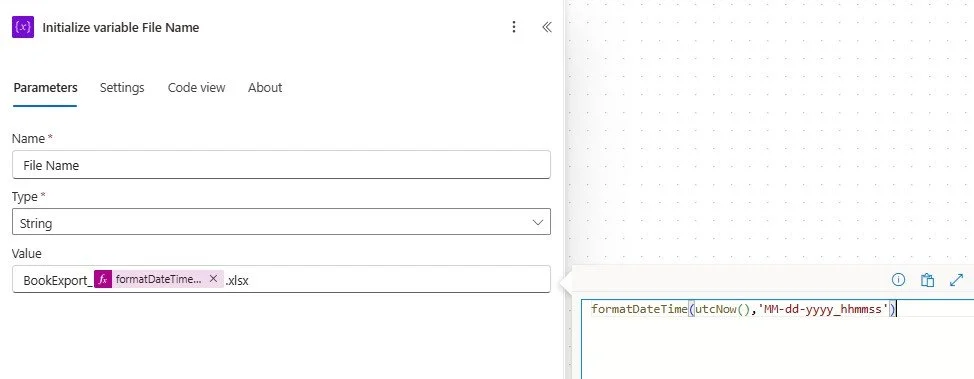
6. Initialize a variable of type String to store the file name. The file name should include both a static value and a dynamic timestamp to ensure uniqueness. A common approach is:
formatDateTime(utcNow(),'MM-dd-yyyy_hhmmss')
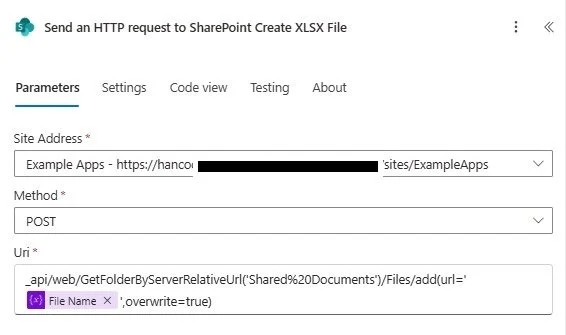
7. Add Send an HTTP request to SharePoint to create the Excel file. Select your SharePoint site address, set the method to POST, and use the following URI:
_api/web/GetFolderByServerRelativeUrl('Shared%20Documents')/Files/add(url='@{variables('File Name')}',overwrite=true)
This example uses the default Shared Documents library. If your document library name contains spaces, replace them with %20 in the URI.
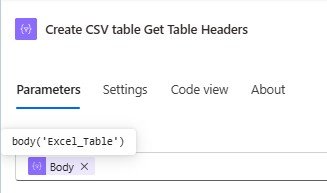
8. Add a Create CSV table action to dynamically extract column headers. Reference the output from the Select action to generate the header row for the Excel table.
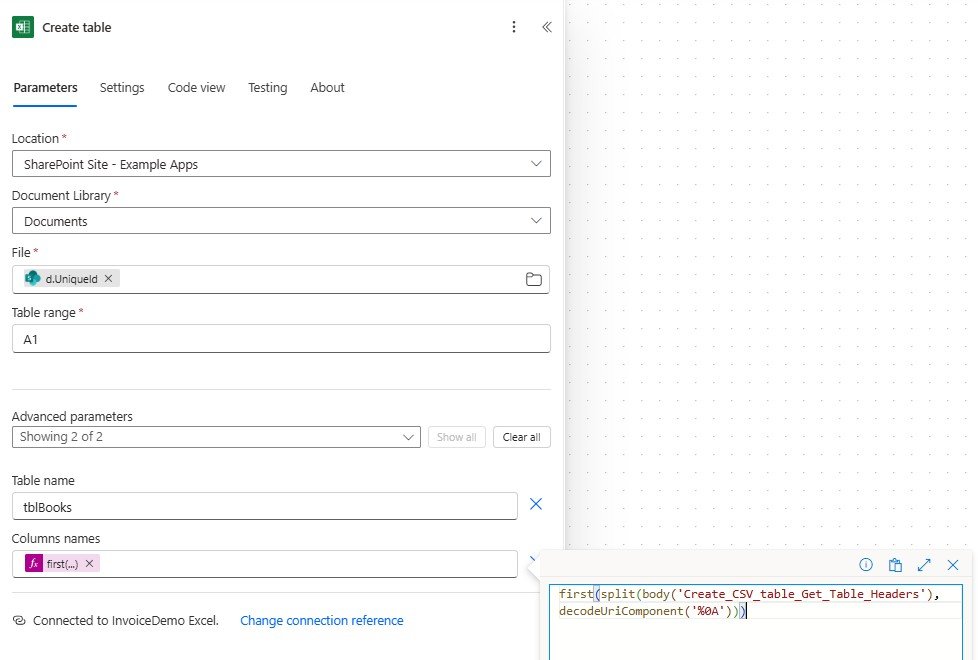
9. Add a Create table action. Select your SharePoint site and document library, then reference the newly created file using:
body('Send_an_HTTP_request_to_SharePoint_Create_XLSX_File')['d']['UniqueId']
Set the table range to start at A1, assign a table name, and populate the column names using the first row of the CSV output:
first(split(body('Create_CSV_table_Get_Table_Headers'), decodeUriComponent('%0A')))
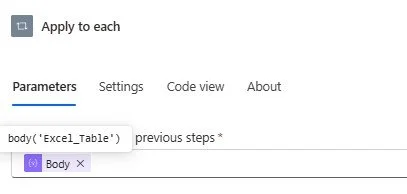
10. Add an Apply to each action and set it to iterate over the array created in your original Select step.
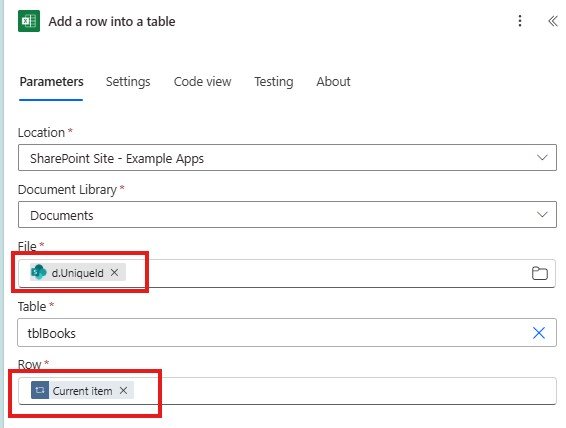
11. Inside the loop, add Add a row into a table. Select your SharePoint site, document library, file ID (body('Send_an_HTTP_request_to_SharePoint_Create_XLSX_File')['d']['UniqueId']), and table name. For the row values, use Current item from the Apply to each action:
items('Apply_to_each')
Part 3: Test the Flow and Verify the Output
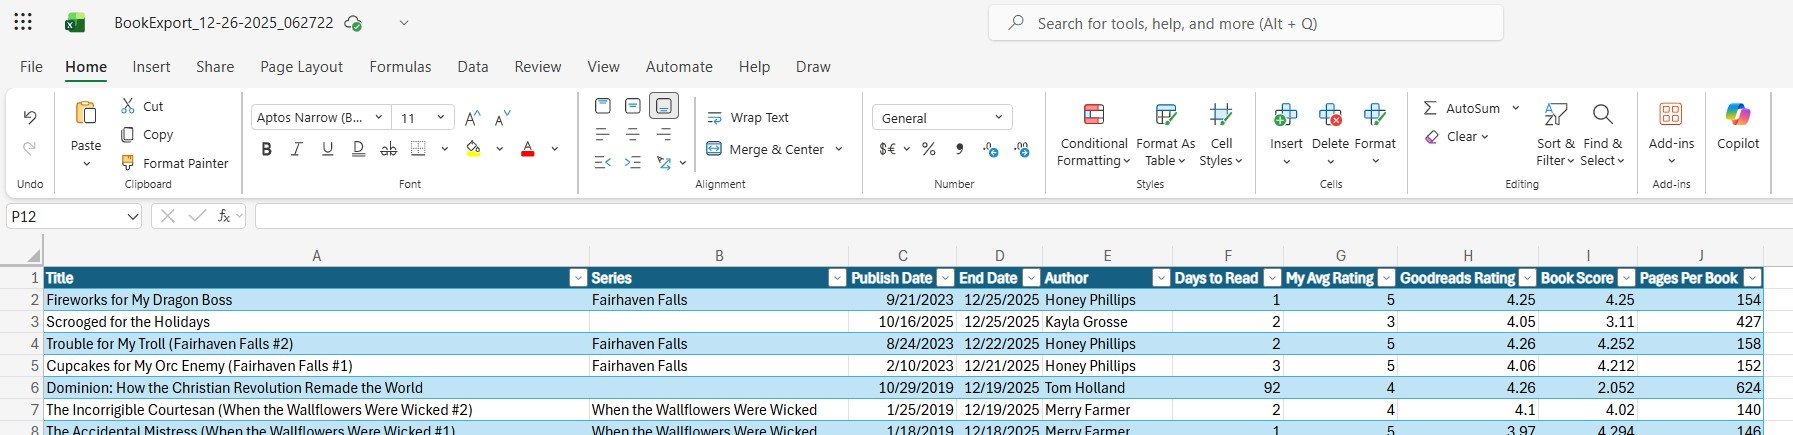
Manually run a test of the flow to confirm that it completes successfully and that the Excel file is created without errors.
After the flow finishes, navigate to the target SharePoint document library, open the newly created file, and verify that the data, column headers, and formatting match your expectations.

Common Issues and Troubleshooting
Even with a working flow, there are a few common issues you may run into when exporting Power BI data to Excel using Power Automate. The sections below cover the most frequent problems and how to resolve them.
Missing or Incomplete Data
If your Excel file contains fewer rows than expected, double-check the DAX query used in the Run a query against a dataset action. Power BI often includes a TOPN function by default, which limits results. Make sure the TOPN wrapper has been removed and that the EVALUATE statement references the __DS0Core table.
“Column Not Found” Errors in the Select Action
This usually happens when the column name in the Select action does not exactly match the name returned by the Power BI query. Copying the first row of the dataset output into a text editor can help ensure you are using the correct field names, including any prefixes added by Power BI.
Date Values Not Formatting Correctly
Power BI often returns dates in a format that doesn’t translate cleanly to Excel. If dates appear incorrect or unreadable, wrap the field in a formatDateTime() expression in the Select action to explicitly control the output format.
Excel Table Creation Fails
The Create table action requires valid column headers. If this step fails, confirm that the Create CSV table action is producing a header row and that decodeUriComponent('%0A') is included when splitting the CSV output. This ensures the column names are parsed correctly.
File Created but No Data Added
If the Excel file is created but remains empty, verify that the Apply to each action is iterating over the correct array. The loop should reference the output from the Select action, and the Add a row into a table step should use the Current item value.
Duplicate or Overwritten Files
If files are being overwritten, confirm that your file name includes a dynamic value such as a timestamp. Including hhmmss in your formatDateTime() expression helps ensure each run produces a unique file name.
Permission or Access Errors
The user account or connection running the flow must have access to:
The Power BI workspace and dataset
The SharePoint site and document library
If the flow runs successfully for some users but not others, this is often a permissions issue rather than a configuration problem.
Conclusion
You don’t need to recreate business logic in Power Automate to export Power BI data. By reusing the DAX query behind an existing visual, you ensure the exported data stays consistent with what users see in reports.
Performance Analyzer is a powerful but often underused tool for extracting the exact query Power BI executes, including filters and calculations already in place.
While Power Automate doesn’t offer a true out-of-the-box action to create and populate a new Excel file, combining HTTP requests, table creation, and row insertion makes it possible to fully automate the process.
Using dynamic file names with timestamps helps prevent overwrites and makes daily exports easier to manage and audit.
Taking time to validate your flow output and understand common failure points (such as column naming and permissions) can save significant troubleshooting time later.